

The US economy added jobs last year and inflation fell to 2.4% in January, its lowest figure in months, and the White House declared the inflation crisis over. Six weeks later, a war began in the Persian Gulf, oil prices surged past $100 a barrel, and the entire pricing structure of the American economy started to buckle. Those two facts exist simultaneously, and the distance between them tells you almost everything about what the next inflation reading is going to reveal.
The conventional view among market commentators is that inflation was on a slow, grinding path back to normal. The tariff disruptions of 2025 had worked their way through goods prices, the labor market was cooling without collapsing, and the Federal Reserve was inching toward rate cuts. The Iran conflict was supposed to be a geopolitical event, not an economic one. Supply disruptions were expected to be temporary. Energy prices would spike and settle. The framing assumed supply disruptions would be temporary, echoing earlier assumptions about inflation being transitory.
That framing is wrong, and we’re about to find out how wrong. The CPI data due this month will be the first hard measure of American consumer prices since the Strait of Hormuz became a conflict zone, and every early signal points to a number that will shock people who stopped paying attention to energy transmission mechanisms after 2022.
What the January baseline actually tells us
Start with where things stood before the war. In January 2026, the Bureau of Labor Statistics reported headline CPI at 2.4% year-over-year, with core CPI (stripping out food and energy) up 0.3% month-over-month. Economic forecasters had expected slightly higher numbers. The White House claimed the figure as vindication, framing it as proof that the administration’s economic agenda was working.
Fed Chair Jerome Powell offered a more measured assessment. He acknowledged that tariff effects were still passing through but Powell has suggested that tariff-related price effects would represent a one-time adjustment rather than sustained inflation. That was the working assumption across Wall Street. A predictable curve. A manageable adjustment.
What Powell and almost everyone else was modeling for did not include a major naval conflict shutting down the world’s most important oil chokepoint.
The January number is now a historical artifact. It describes an economy that no longer exists. And the gap between 2.4% and whatever the next reading shows will represent something more than a statistical move. It will represent the cost of a war priced into every gas station, shipping container, and grocery shelf in America.
The oil transmission mechanism is faster than people think
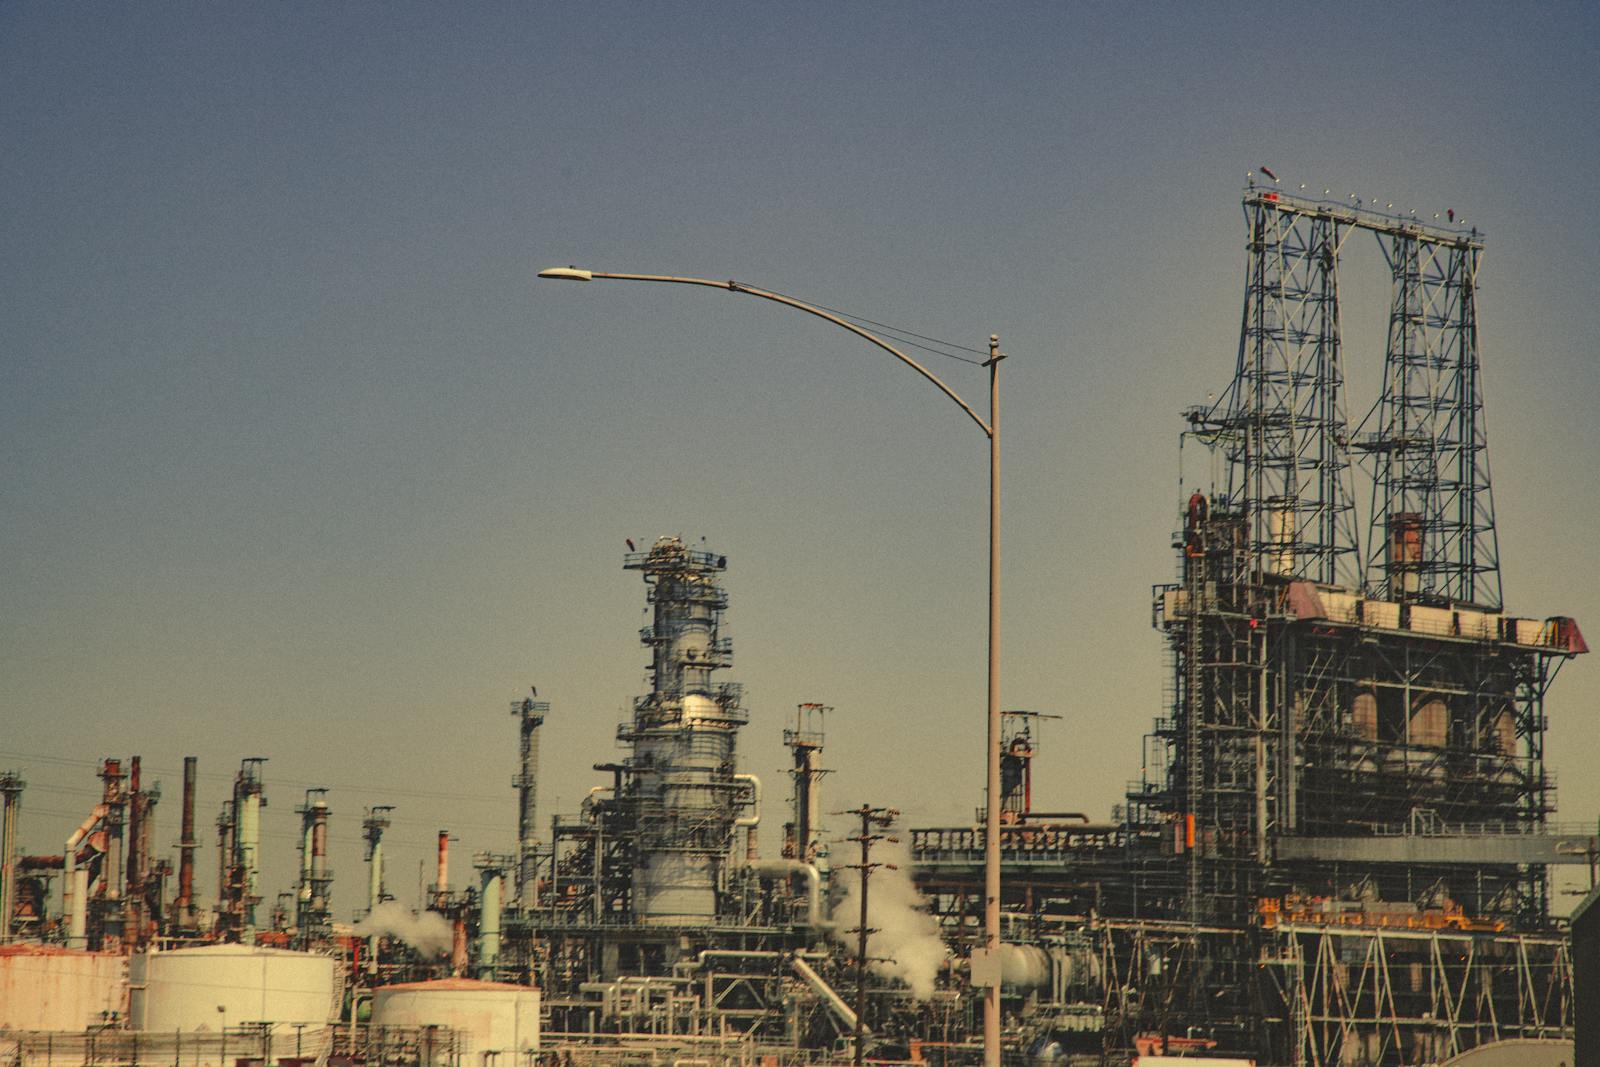
If you’ve spent any time studying economic history, the 1973 oil shock stands out as the definitive case study in how energy price spikes translate into broad inflation. The mechanism isn’t mysterious. Oil feeds into transportation costs, which feed into food prices, manufacturing costs, heating bills, and eventually services. The question is always about speed and scale.
This time, the scale is unprecedented. Iran’s Hormuz blockade has removed roughly 20% of global oil supply, which is twice the volume disrupted in the 1973 Arab oil embargo. Brent crude has crossed $100 a barrel, and futures markets suggest it could stay there for months.
The speed of the pass-through is what matters for the upcoming CPI print. Gas prices move within days of crude oil shifts. Airline fuel surcharges adjust within weeks. Shipping costs begin repricing almost immediately for new bookings. And food, which Americans feel more viscerally than any other category, starts moving within four to six weeks as transportation and input costs cascade through supply chains.
The war escalated in mid-March. The April CPI data will capture the tail end of March and the full force of early April pricing. That means the number Bloomberg and other outlets are flagging as a likely spike isn’t speculative. The energy component alone could push headline CPI up by a full percentage point or more from its January reading.

Why this isn’t 2022 all over again
The instinct will be to compare this to the inflation spike after Russia’s invasion of Ukraine. Energy prices surged, inflation peaked in mid-2022, and then it came back down as supply chains rerouted and demand destruction set in. Many analysts are already making this comparison, arguing that the Iran war inflation will similarly be a spike-and-fade pattern.
But the structural conditions are different in important ways.
First, the Strategic Petroleum Reserve is depleted relative to 2022. The Biden administration drew it down aggressively during the Ukraine crisis and refilling has been slow. The buffer is thinner.
Second, interest rates are already elevated. In 2022, the Fed was near zero and had room to tighten aggressively to fight inflation expectations. Today, the federal funds rate sits well above that, and the Fed faces a dilemma it didn’t face then: tighten into an energy shock and risk recession, or hold steady and risk inflation expectations de-anchoring. There are no good options, only degrees of bad.
Third, the labor market is weaker. The economy added 181,000 jobs in 2025, compared with 2 million in 2024. Workers have less bargaining power to absorb price increases through wage gains. That means energy inflation eats directly into real purchasing power rather than getting offset by rising incomes.
The UK is already showing how this plays out in a different economy with similar exposure. Nationwide reported that British mortgage rates have surged from 4.83% to 5.84% for two-year fixed deals since the start of March, as the Bank of England shifted from expected rate cuts to expected rate hikes. Housing affordability gains from recent years are being reversed. The dynamic in the US will be different in specifics but similar in direction: financial conditions tightening at the worst possible moment.
The political economy of an inflation print
I spend a lot of time thinking about the gap between official narratives and how systems actually operate. It’s what drives the work I do building media that cuts through surface-level framing to examine how power actually functions. And this inflation number sits right at the intersection of economic reality and political management in a way that’s hard to miss.
The White House had built its economic messaging around the January 2.4% figure. In a statement that now reads as almost comically premature, the administration claimed to have defeated the previous inflation crisis and predicted further economic acceleration. The administration argued the economy would accelerate further through anticipated Fed rate cuts. Rate cuts are now off the table for the foreseeable future. The opposite might happen.
The political problem is compounded by what was already a bad trajectory. A February Economist/YouGov poll showed Trump’s job approval at 37%, his lowest across both terms, with inflation as the issue where he scored worst. Voters who elected him partly on a promise to fix prices are watching those prices rise again, and this time the White House can’t credibly blame the previous administration.
What the Fed actually faces
Jerome Powell’s predicament deserves more attention than it’s getting. When Powell described tariff effects as a one-time adjustment, he was describing a world where the primary inflation risk was policy-driven (tariffs) rather than supply-driven (war). Policy-driven inflation is at least theoretically within the government’s control to reverse. A supply shock of this magnitude is not.
The textbook response to a supply shock is to look through it. Don’t tighten monetary policy in response to a temporary energy spike because doing so destroys demand without addressing the actual supply problem. This was the playbook after the 1979 oil crisis, and it failed badly, because the spike wasn’t temporary and inflation expectations became embedded. The question Powell faces now is whether this shock is more like 1973 — severe but eventually self-correcting once supply reroutes — or more like 1979, a prolonged disruption that changes the inflation regime entirely. The answer depends on the war’s duration and whether alternative supply routes can compensate for the Hormuz disruption. Neither of those variables is within the Fed’s control. And the upcoming CPI print will force Powell to take a position before anyone actually knows which historical analogy applies, with financial markets that had been pricing in rate cuts for the second half of 2026 already repricing aggressively in the other direction. The stock market, which has been rallying and plunging on ambiguous diplomatic signals from Tehran and Washington, is about to have to reckon with a harder number than a press conference soundbite.
Who absorbs the cost
This is where the analysis usually stops in mainstream financial coverage: the CPI number, the Fed’s response, the market implications. But inflation is not an abstraction. It is a distributional event. It takes wealth from one group and transfers it to another, and the direction of that transfer tells you who designed the system.
Energy price spikes are regressive. A household earning $40,000 a year spends a far larger share of its income on gas, heating, and food (all energy-intensive categories) than a household earning $400,000. The CPI number will be the same for both, but the experienced inflation will be wildly different.
I wrote recently about how the Global South is building alternative technology infrastructure partly because of the recognition that depending on concentrated systems controlled by a few actors creates vulnerability. The same logic applies to energy. The US economy’s exposure to Hormuz isn’t a bug in an otherwise well-designed system. It’s a structural dependency that converts geopolitical instability into household-level economic pain, distributed along lines of class.
The households best positioned to absorb a spike are those with assets that rise with inflation: real estate, commodities, equities in energy companies. The households worst positioned are those living on fixed incomes or wages that lag price adjustments. The Nationwide analysis of the UK market noted that Analysis from Nationwide suggests UK household finances remain generally stable in aggregate, though many households are still recovering from recent cost pressures. The aggregate figure conceals the dispersion. It always does.
I notice this living in Singapore, where energy costs get managed differently than in the US or UK because the government treats energy security as a national priority rather than leaving it to market dynamics. The policy choices that determine who absorbs an energy shock are political decisions, not economic inevitabilities. The fact that American households at the bottom of the income distribution will bear the highest proportional cost of this war is a choice, embedded in decades of energy policy, tax policy, and the deliberate weakening of social insurance programs.
The number and what it reveals
When the CPI print drops, the headline number will dominate coverage for about 48 hours. Cable news will fixate on whether it starts with a 3 or a 4. Traders will adjust positions. The White House will blame Iran. The opposition will blame the White House. Both will be partially right and entirely self-serving.
What the number will obscure is the structural story. The US economy entered this conflict with inflation nearly tamed, a weakening labor market, an already-depleted strategic reserve, and a political class that had declared victory on prices six weeks before a war made that declaration absurd. The gap between where inflation was heading and where it’s now going is not just a statistical revision. It represents the cost of building an economy on the assumption that global supply chains would remain uninterrupted and that the most contested waterway on earth would stay open.
I’ve been writing about how power concentrates in systems that appear decentralized, whether in orbital data centers or platform economics. The same principle applies here. The global oil market looks like a market, with thousands of participants and transparent pricing. But 20% of its supply flows through a single geographic chokepoint, and when that chokepoint closes, the “market” reveals itself as a system of concentrated risk that’s been disguised as distributed efficiency.
That is what the next inflation reading is going to reveal. Not just a number, but a measure of the distance between the economy we were told we had — 2.4% and falling, crisis over, victory declared — and the economy that actually exists: structurally exposed, strategically depleted, and now absorbing the largest supply shock since the 1970s with no SPR buffer to draw down and no Fed room to cut into. The January figure was a finish line. The April figure will be proof it was a starting gun. And the people who will pay the most for that miscalculation are, as always, the ones who had the least say in building the system that produced it.
Feature image by Ali Mucci on Pexels
