
Building a startup into a sustainable business requires multiple years of commitment. But how do founders see this roadmap? When do we expect the company to be generating revenues? How steep should the proverbial hockey stick be? Equidam, through its valuation platform, took into account the financial projections for a sample of more than 15.000 early stage ventures across the globe.
Creating and presenting revenue forecasts to investors is always tricky. Too high and they will not be believed, too conservative they will lower the interest of the other party. The lack of knowledge on how founders see the future stems out of the little data about startups financial projections. Companies providing forecasts have an intrinsic incentive in being accurate one possible, receiving a fair valuation.
Benchmarks to estimate the growth rate for startups
Forecasting revenues really comes down to a growth rate. No matter if the company starts from scratch or not, the final outcome is the growth rate and the argumentation that makes it achievable.
In our analysis, we look at the latest year of financials (YTD) plus the next three years of forecasted revenues. From these, we are able to study the annual revenue growth coefficients for the upcoming 3 years.
The average company forecasts 120% revenue growth for their first year, 83% for the second, and 60% for the third.
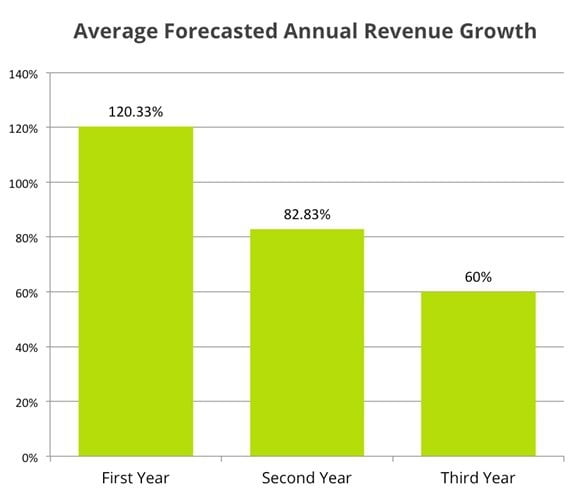 This means that a company that grossed $500.000 Year to Date (YTD) will forecast $1.100.000 for next year, 2.013.000 for the following one and $3.220.800 for the third one.
Growth rates however vary widely by industry, country, and stage of development of the venture. Companies that start from scratch will of course find it easier to growth their revenues at higher percentage rates. The reason for it is that a smaller number is easier to grow compared to a large one.
On top, different sectors have different setup times, adoption speeds, sales cycles and market opportunities. Finally, countries have different home-market sizes, access to funding and talent etc.
To benchmark the companies against the size factor, we divide them into 3 classes of YTD revenues: $1k to $50k in starting annual revenues compose the “small” group, $50k to $250k the “medium” and above $250k the “large”.
Not surprisingly, U.S. “small” companies are the most ambitious, forecasting 740% growth in their first year.
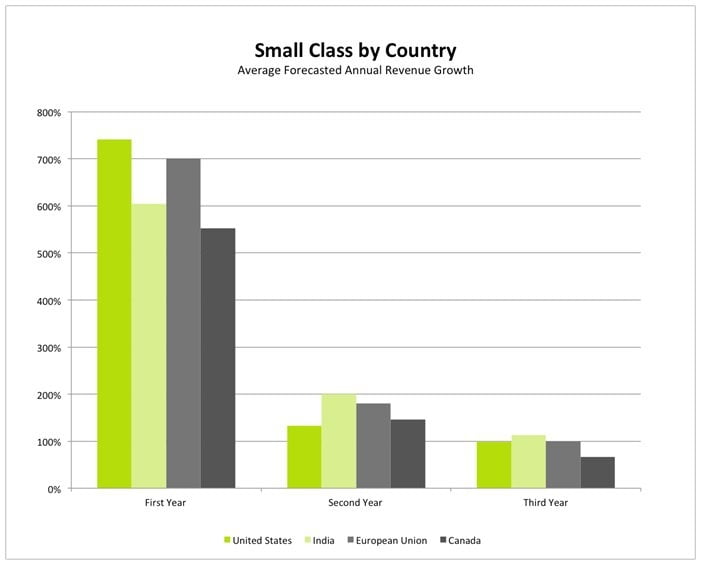 They do, however, align with other countries for the upcoming years. They grow more conservative as they grow larger.
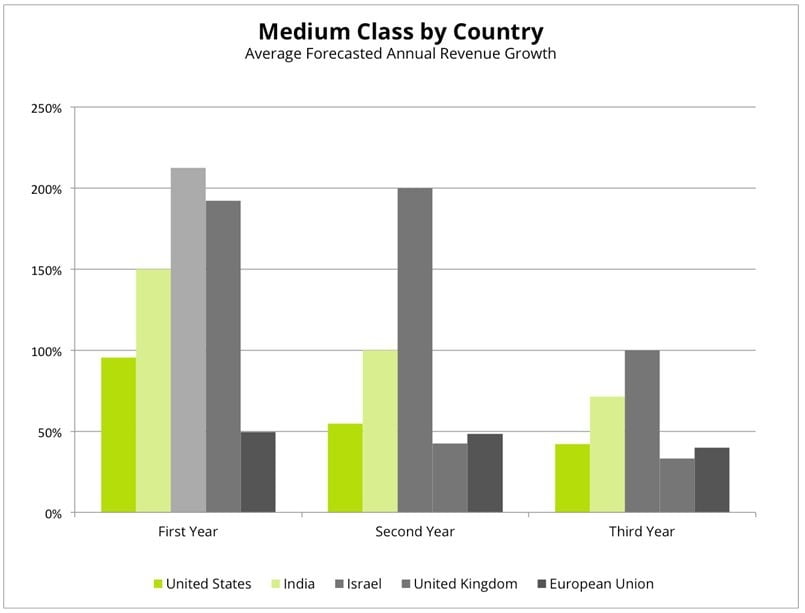
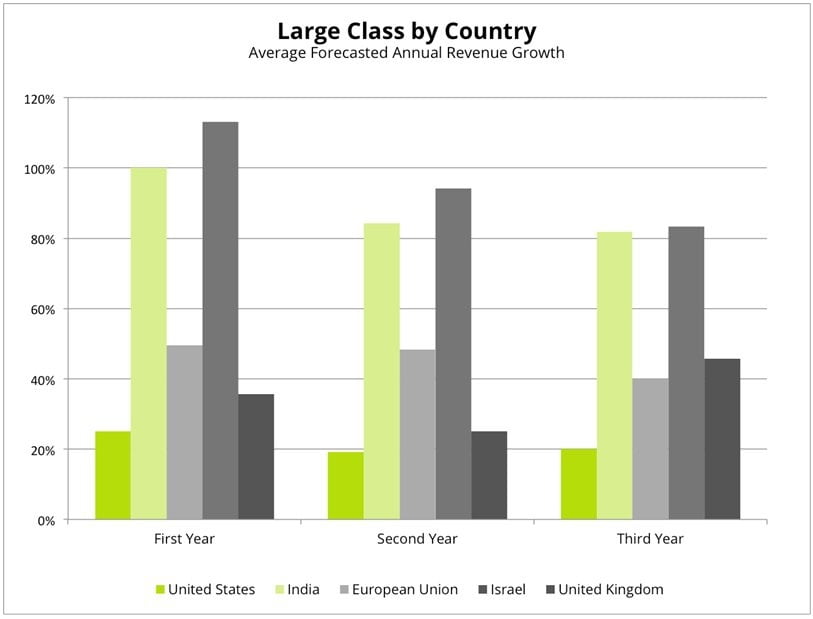
The medium and large group tell a different story. Once the company is slightly more established, the ambition mostly comes from India and Israel, outclassing their American counterparts.
The sector with the highest growth expectations is …
What about different sectors then?
The sector that projects the highest growth rates is Financial Services, with a wobbling 308% average growth in the first year, 143% the following one, and 86% during the third.
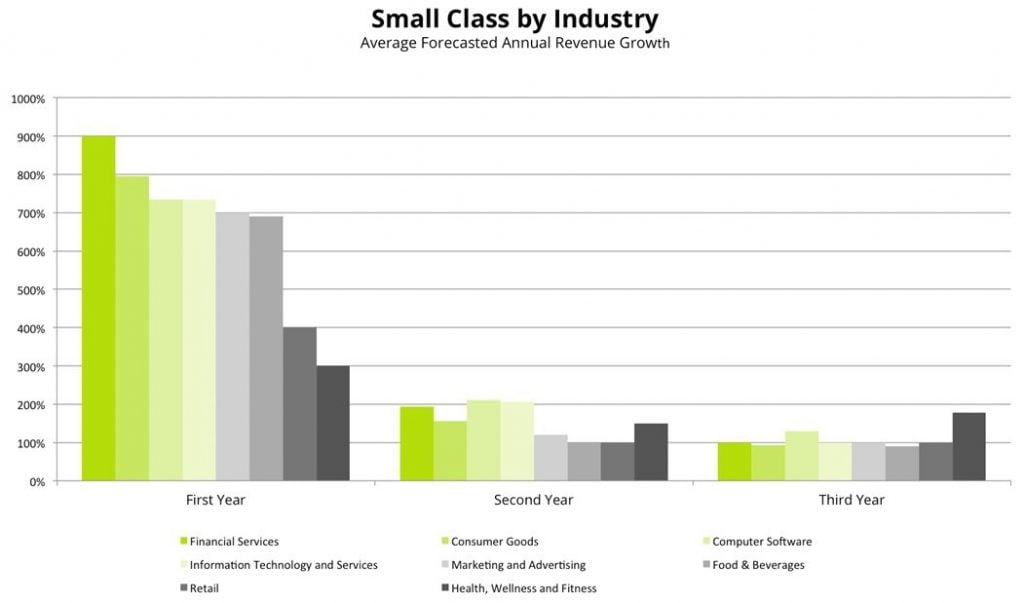
Among companies in the Small class, Financial Services is projecting the largest growth, 900% during the first year.
The second year is leaded by Internet companies, while the third by Wellness and Fitness. Does it take more to create a gym than an Internet company? Founders seem to think so when they are starting from scratch.
 As the companies grow a little larger, we see that Consumer Goods expects the highest growth, while Wellness and Fitness slide behind in last position. This seems to suggest a higher potential and market size, understandable from the overall understanding of these two sectors. Consumer Goods have a larger potential, a larger total market, and if they display strong competitive advantages, on average an opportunity skewed towards large returns.
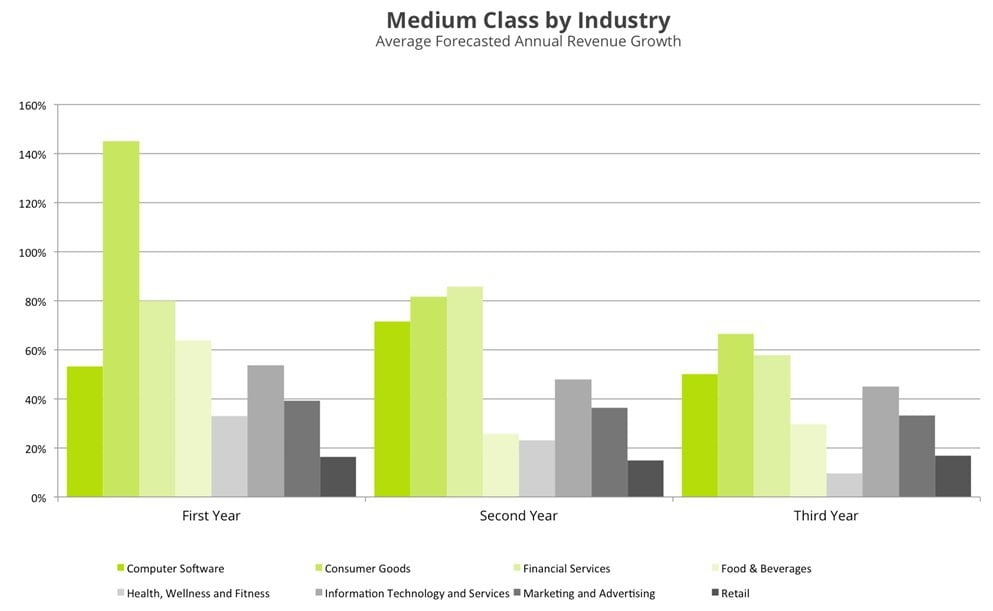 The Large class shows similar behaviors in terms of forecasted opportunity size. It is leaded by IT Services and tailed by Retail.
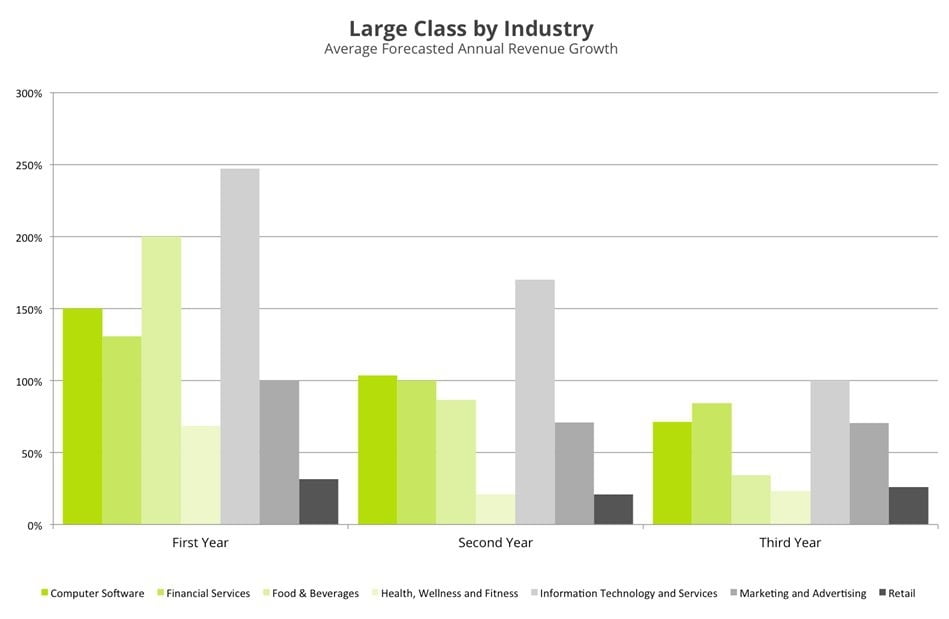 Naturally, companies in the small class have the largest growth percentages. Surprisingly though, they forecast final absolute numbers that are larger than the Medium and Large classes. We are observing this behavior very often. Companies that proved very little of their assumptions are extremely over-optimistic about their future. Then, as they test, iterate and grow, they learn how to better forecast their growth, and generally end up with lower projected revenues.
It takes 24 months from $0 to $1M in annual revenues
The case of pre-revenues companies and over-optimism is an interesting one. Projecting financial performance when the company might not even have a product is complex. So is the over-estimation just a reflection of its complexity?
To counteract this phenomenon we looked into the forecasted time from zero revenues to $1 million in annual revenues.
With this, we really want to investigate the early days, the days where founders are struggling for cash, are bootstrapping, but they are still dreaming the future. And the results are surprising.
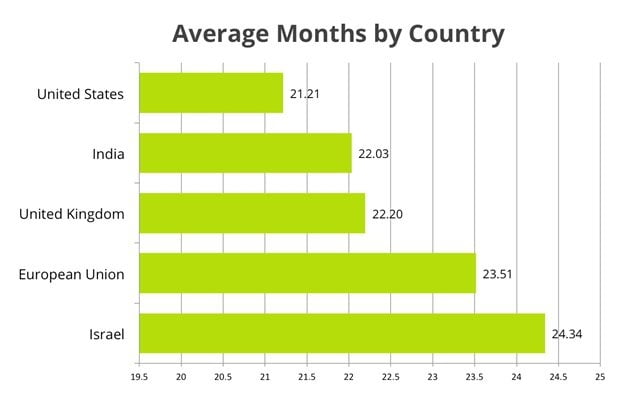
We first looked at the projected time to $1m revenues per country. Interestingly enough, across 5 of the largest startup ecosystems – United States, India, Israel, UK and EU – founders’ ambition and time to $1m revenues are very stable around the 23 months average. There are however differences. US startups show higher ambition and forecast the timeframe to 21,21 months on average. Israel is the most conservative of the studied countries with 24.34 months.
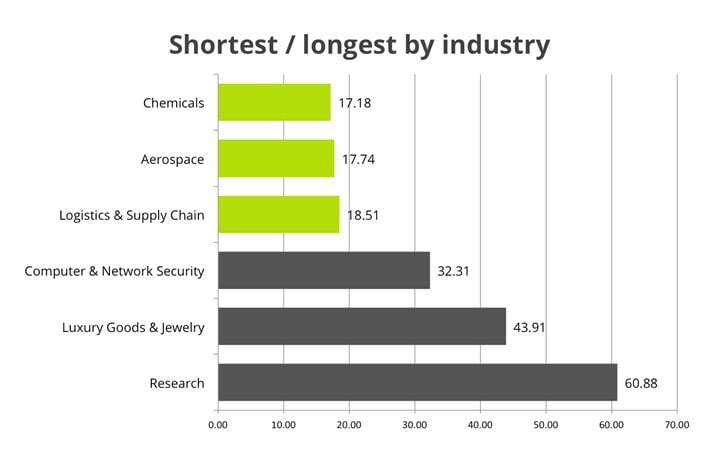
 Breaking down the values by industry gives us more insights into common timeframes. More enterprise-focused industries like Aerospace, Chemicals or Airlines expect shorter timeframes, around 18 months. Consumer facing companies in competitive industries like luxury expect to reach the $1m target in 43 months, with research leading the whole group at 60 months.
 Overall, companies expect to wait between one-and-a-half to five years to reach their target, with a strong prevalence of timeframes around 2 years.
About The Data
The data used in this article comes from the Equidam database. Equidam is the pioneer in online automated valuation for startups and private companies. As part of its activity, Equidam collects financial projection data from users, that can never be shared unless aggregated, and uses it to accomplish its mission of increasing valuation objectivity and accessibility.
The dataset surveys more than 15000 companies in 78 countries, spanning from very early stage and pre-revenues startups to VC backed or more traditional companies.
Conclusion
Startups are growing faster nowadays than ever before. This faster growth is measured in both revenues and valuation. However, everybody’s opinion is always skewed towards the best ones. Only the best startups deserve and receive press attention and this creates the perception that building startups is easy.
When looking at proper statistics comprising both successful and unsuccessful companies, we see that achieving even a first milestone like $1 million in revenues is a long and tedious task.
Once the first revenues are achieved, founders become more aware of the difficulty of growing companies, and make more reasonable financial forecasts.
Despite country and sector differences, one thing unites entrepreneurs all around the globe: optimism.
This article was originally published on: https://www.equidam.com/average-growth-rate-for-startups/
Hockey stick Growth image by Shutterstock: https://www.shutterstock.com/nl/pic-477133846/stock-photo-hockey-player-and-dynamics-graph-mixed-media.html?src=u0K6F1ZGrR6nv99hYcIz6w-1-1


01
From Mexico City to Rotterdam: How the Dutch Startup Visa launched Estefania Hernandez’s HR tech revolution